Circle
Circle is a classic pie chart widget.
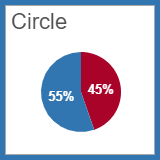
This widget allows to choose and compare several metrics from one object
or several metrics with the same names from several objects. For
example, memory usage - the MEM.percentUsed metric - on two hosts.
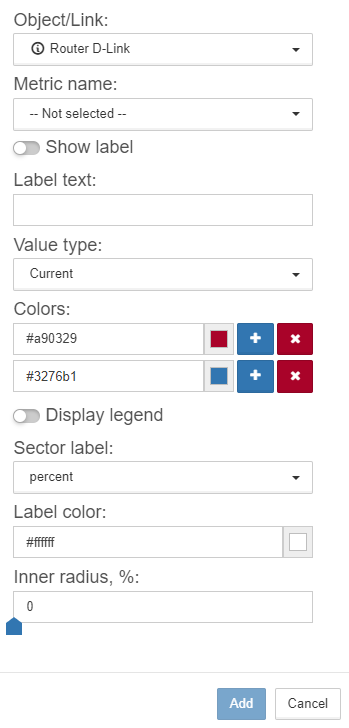
| Field | Description | ||
|---|---|---|---|
Show label |
It displays or hides metric name under its value. |
||
Label text |
It allows to set custom metric name. |
||
Value type |
It allows to select displaying of numeric metric:
|
||
Period |
For all of the value types, except for the current value, it is possible to display the metric value for the last:
|
||
Count from |
It determines the logic of the period count:
|
||
For previous period |
It calculates the metric value for the previous period. |
||
Colors |
It sets the sector colors.
|
||
Display legend |
It displays or hides the legend - the metric name. |
||
Sector label |
It sets the type of the labels to show on the sectors. |
||
Label color |
It changes label colors. |
||
Inner radius, % |
It sets the inner radius of the widget. |
