Data
This section contains a table with the results of the check. You can drag-and-drop columns to change their order.

| Double click on a table cell to copy its content to the clipboard. |
The Data forming rules functionality allows to change obtained metric values, add and remove metrics from the data table. Values of numeric metrics are saved in the database.
With the value NO of the switch Exact values at the header of the section, numbers, greater than 1000, transform to the compact view with K, M, G and T postfixes.
For example:
Exact value |
Compact view |
1 234 |
1,2 K |
1 234 567 |
1,2 M |
1 234 567 890 |
1,2 G |
The button  exports the data to a CSV file.
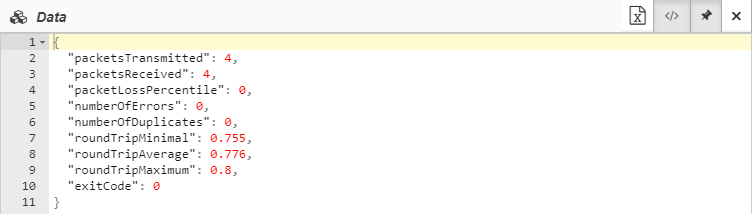
The button  is used for showing data in the JSON format:
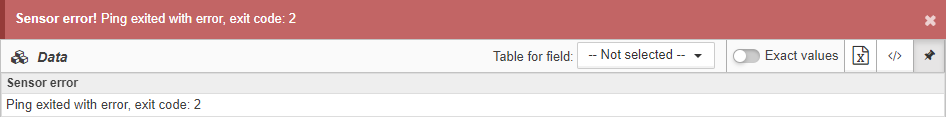
If an error occurs during a check, the corresponding metric is automatically created in the Data table. The metric value contains the text of the error:
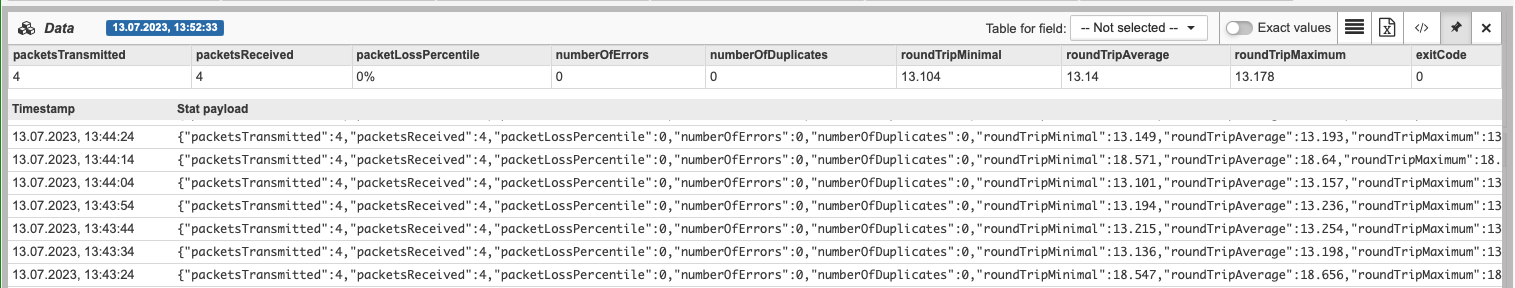
Stat history
The  button isn’t shown by default. Set the value of the client configuration parameter statHistory to button isn’t shown by default. Set the value of the client configuration parameter statHistory to true to show the button.
|
The button opens a stat history table. Each row contains a timestamp and received data in the JSON format.
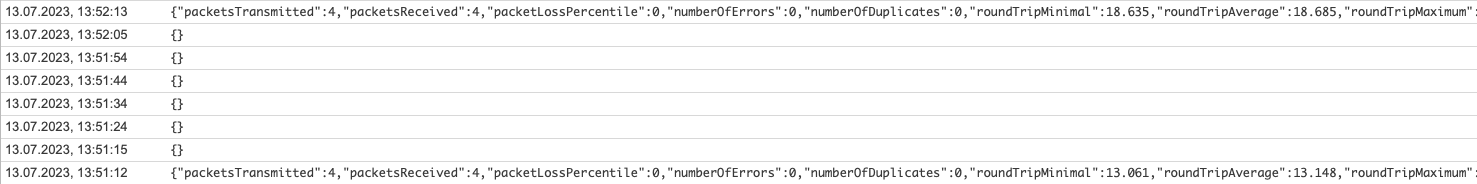
If an error occurs, an empty JSON is written to the stat history.
Export data table
You can export data table in the CSV format. Exported file contains all columns of the data table as the following information:
-
time when the data was received (
timestamp) -
name of object/link, that performed monitoring (
object_name) -
ID of object/link, that performed monitoring (
object_id)
| Exported table doesn’t include the stat history. |
Example of the exported table:
timestamp,object_name,object_id,packetsTransmitted,packetsReceived,packetLossPercentile,numberOfErrors,numberOfDuplicates,roundTripMinimal,roundTripAverage,roundTripMaximum,exitCode
"06/12/2023, 14:49:19 (UTC+3)",PingObject,63402059d7821a25ba286f47,4,4,0%,0,0,15.255,15.315,15.38,0