Widgets time range
By default, graphs in the End view show data for the last hour. For widgets, which display data for the time period, the period is set individually while the widget is being created.
The button Widgets time range allows to set temporally another time range for displaying data on all graphs and widgets. Clicking the button opens the window where it is possible to select relative or absolute time range and grouping option.
Selected settings are activated after clicking the button  . In order to turn the settings back to original ones, it is necessary to click the button
  .
.
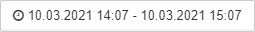
The set time range is displayed directly on the button:
Relative range
If the relative time range is selected, graphs and widgets are automatically updated according to the current time.
It is necessary to select a range and way to count the period.
Data on the button is updated every minute.
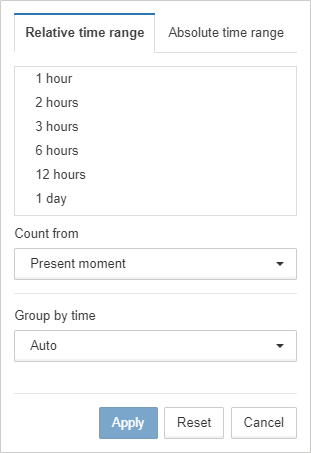
The field Count from sets logic of the period count:
-
present moment - to display the data for the selected period, counting from the present moment;
-
calendar period - to display the data for the selected period, counting from the calendar beginning.
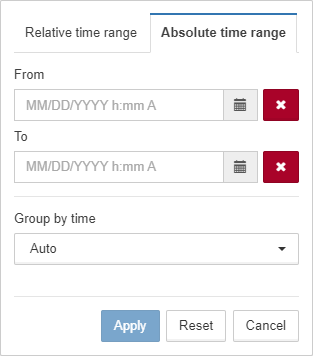
Absolute range
If the absolute time range is selected, graphs and widgets always use this period.
The beginning and end of the period must be set manually.
The button ![]() opens the calendar to select date and time.
opens the calendar to select date and time.
The button ![]() clears the corresponded field.
clears the corresponded field.
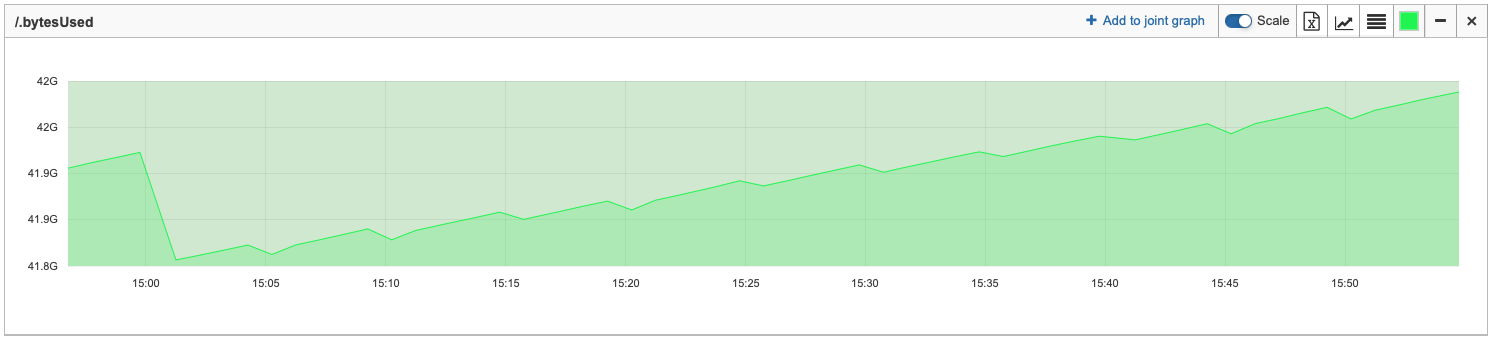
| If you zoom into any graph, the selected time period is automatically applied to the absolute time range. |