Grafana integration
Grafana is a popular tool for data visualization, which allows to display graphs and diagrams on convenient visual dashboards.
SAYMON integrates with Grafana through a special datasource plugin that allows to display the data from specified metrics from specified SAYMON objects on diagrams. Using the standard Grafana toolkit, the data are visualized and on the base of the data dashboards are built.
The sequence of steps for adding data of the metric from SAYMON to Grafana is described below. All of the actions related to integration are implemented in Grafana.
-
Log in to Grafana.
-
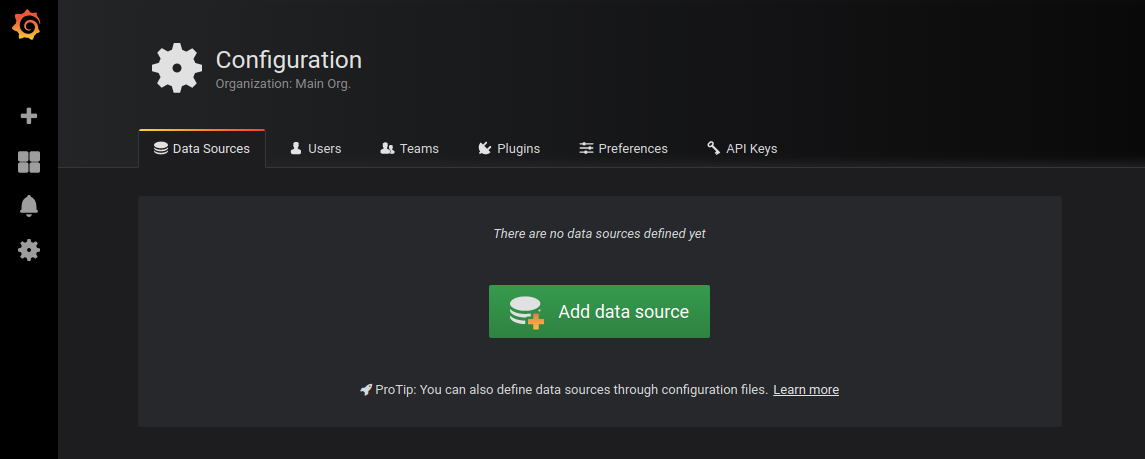
From the main page of the workspace go to Configurations - Data Sources through the side menu and add the data source by clicking the corresponding button.
-
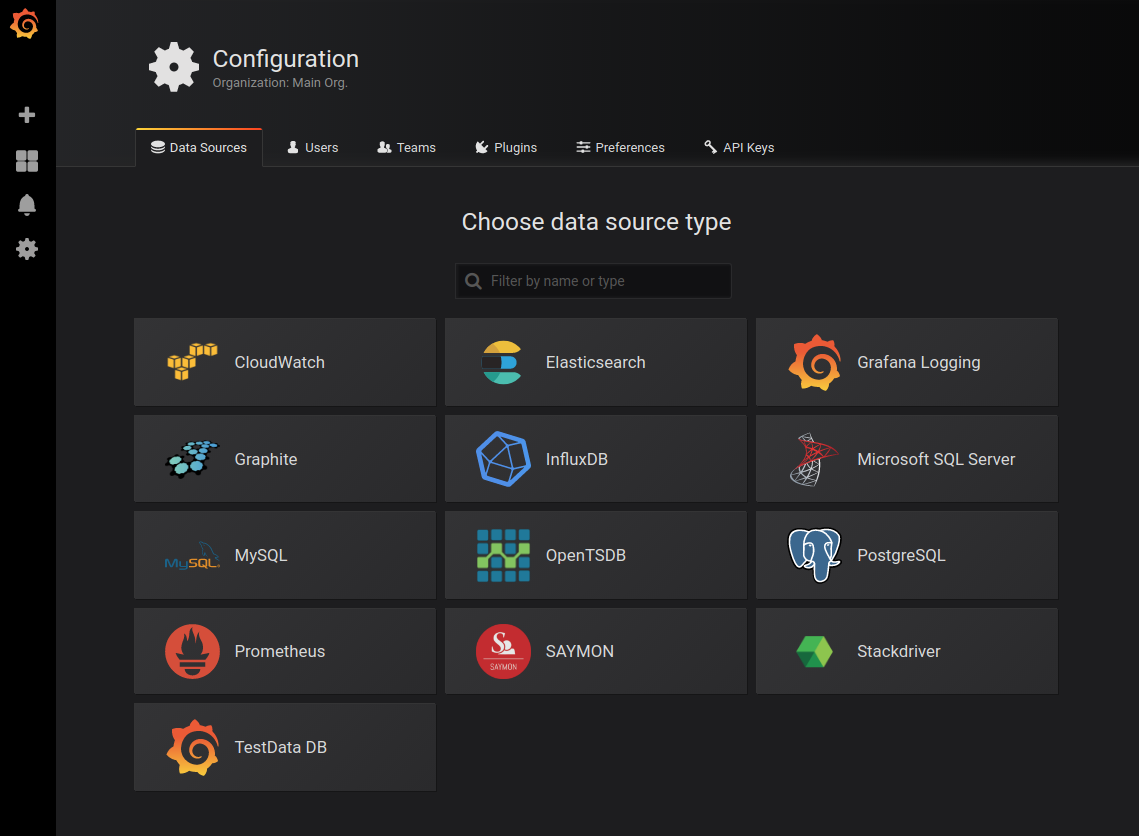
In the opened data source type window, select SAYMON.
-
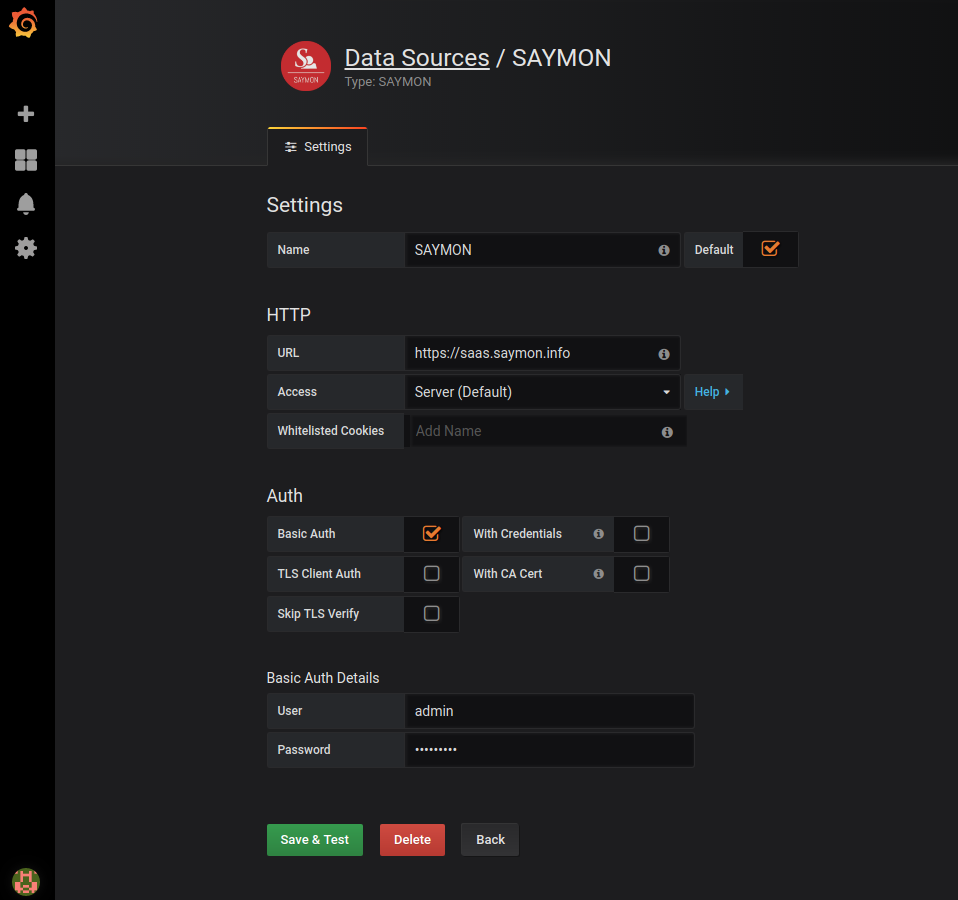
In the settings window specify:
-
the name of the data source;
-
URL from which the data will be collected;
-
the way requests to the data source will be processed: server or browser;
-
names of cookies files that should be forwarded to the data source;
-
authentication type;
-
basic authentication details: username and password used in SAYMON.
-
-
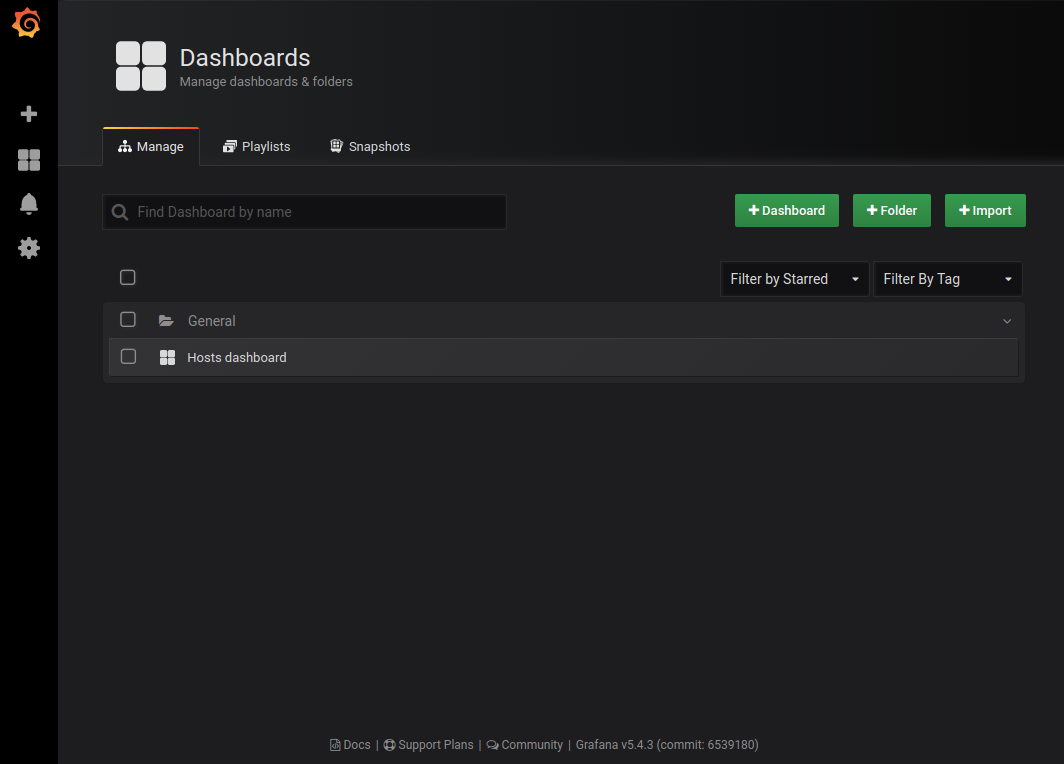
Through the side menu, go to the dashboards management window (dashboards - manage) and start creating a new dashboard by clicking the corresponding button.
-
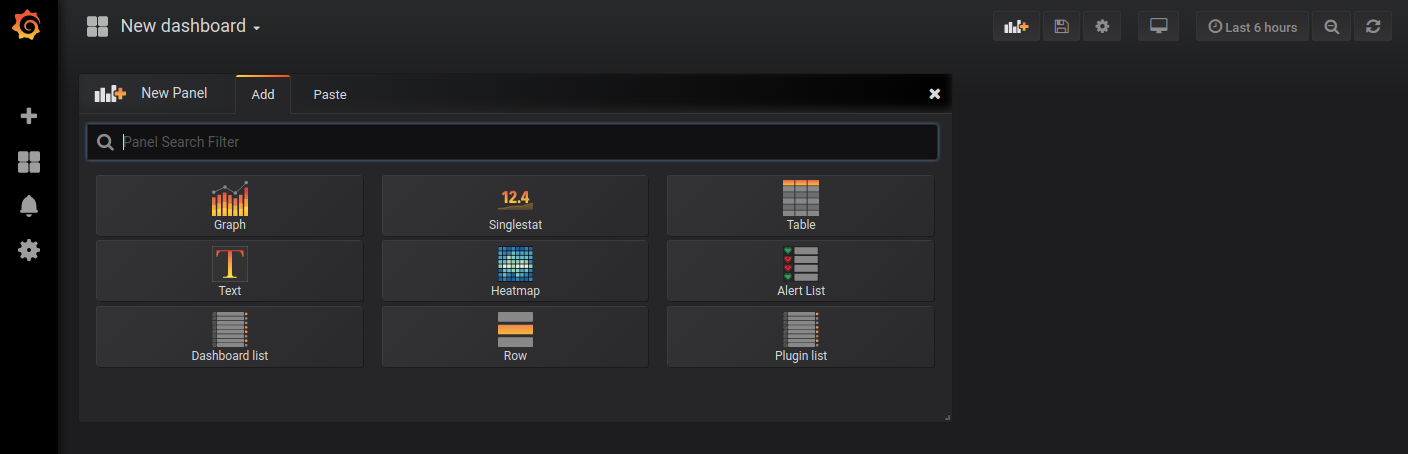
Select a type of the dashboard display. For example, a graph.
-
Call the context menu by clicking on the arrow next to the panel title and switch to the edit mode.
-
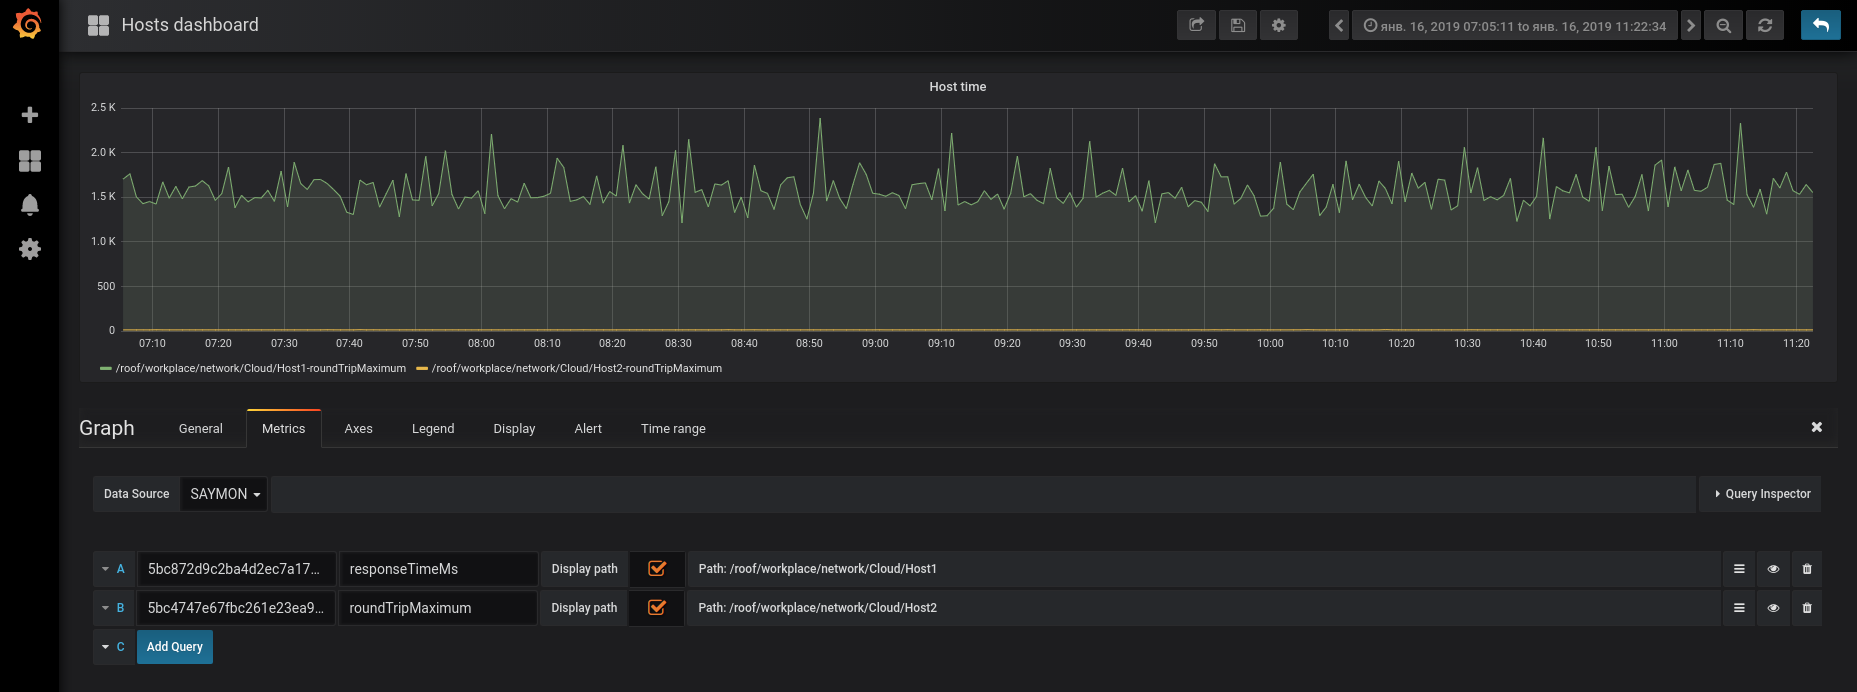
In the editing window go to the Metrics tab and add the objects to which the user has access in SAYMON. Specify:
-
the ID or the name of the object;
-
the metric to be displayed on the graph;
-
whether the path to the object must be displayed.
-
-
Configure the time period for which the data are displayed on the graph, and the interval for updating them.