Graphs
Graphs are plotted automatically for all numeric values from the Data table.
A graph can be plotted for:
-
a metric from the current object,
-
a metric from another object (the object name will be displayed before the metric name in the header of the graph section),
-
a constant user defined value,
-
a user defined math formula using constants and metrics from different objects.
The formula which the graph is based on will be displayed in the header of the graph section.
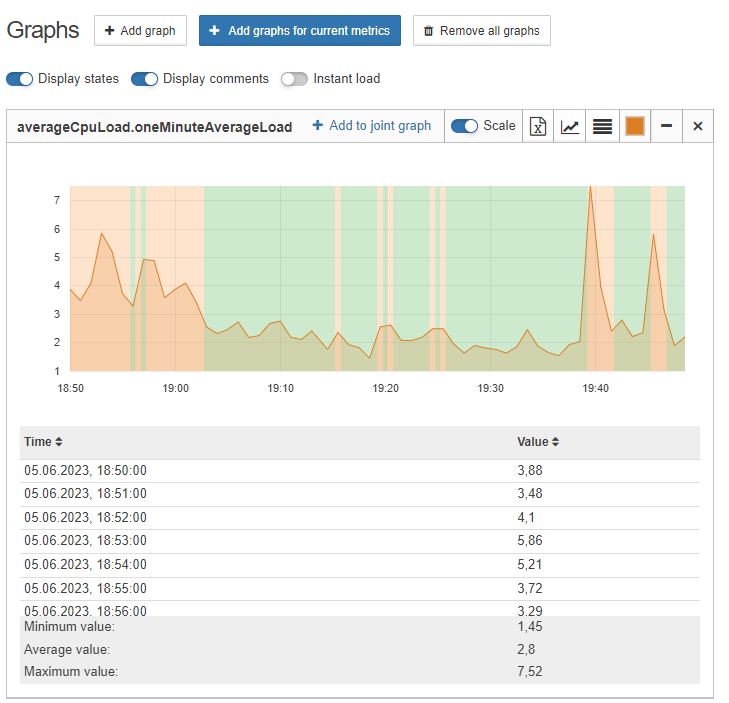
With set the Display states slider into the YES position the background colors of the graphs correspond to the colors of states in which the objects were at a point in time.
The Display comments slider enables the possibility to post and watch the comments on graphs.
The data for plotting graphs is requested with the first appearing of the graph on the screen and every 10 seconds after. If the Instant load slider set into the YES position the data is requested instantly when the graph appears on the screen (graph section collapsing or expanding, page scrolling, etc.). This allows to observe changes of metrics and take decisions faster.
| Instant data load raises the load to the web client, network and server. With refreshing the page the slider is automatically set to the NO position. |