Chart
Chart is the widget to plot graphs.
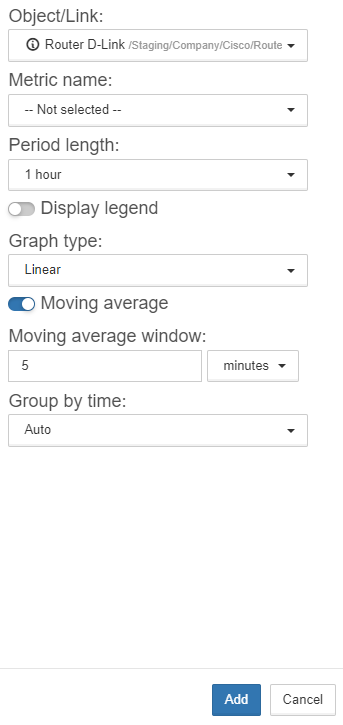
This widget allows to display:
for the last:
-
1 hour;
-
3 hours;
-
12 hours;
-
1 day;
-
3 days;
-
1 week;
-
1 month.
|
Widgets time range |

| Field | Description |
|---|---|
Display legend |
It displays or hides the legend - to display the metric name. |
Graph type |
It allows to switch between histogram and linear chart. |
Moving average |
It allows to plot graph of trend. |
Group by time |
It allows to use decimation and show average values for the selected period. |
Changing scale values (for multigraphs). |