Adding graphs and multigraphs
Graphs are plotted automatically for all numeric values from the Data table.
The possibility to add graphs is used in the following cases:
-
the needed graph was removed;
-
data structure has been changed and new metrics start to come;
-
a multigraph (several graphs on a single panel) needs to be plotted;
-
a graph for a metric of another object needs to be plotted;
-
a graph based on math operations needs to be plotted.
These cases can be combined.
Adding a new graph
In order to add a new graph it is necessary to:
-
Click the button
 over the list of graphs.
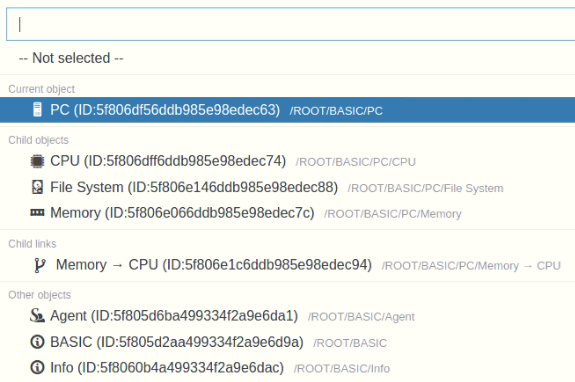
The panel with the current object and its numeric metrics will appear:
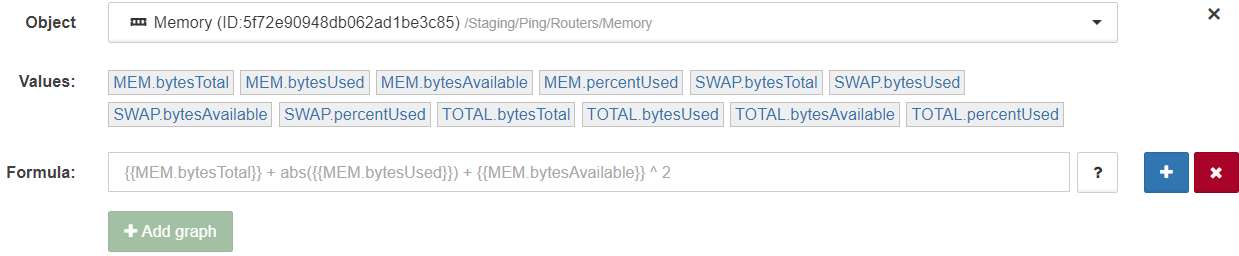
-
Select the metric from the current object or any other one.
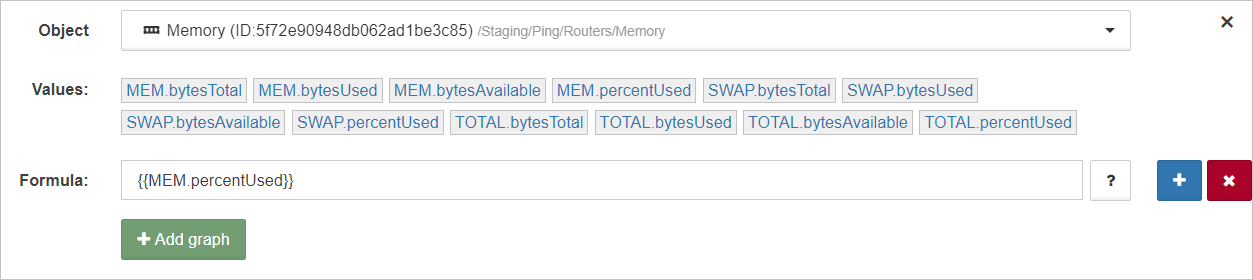
There are two ways to select a metric from the current object:
-
to click on the needed metric;
-
to start entering the name of the metric in double curly braces into the field Formula, and select the metric from the filtered list.
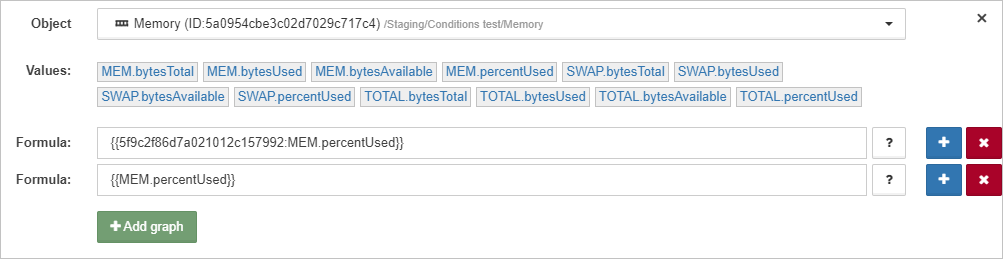
There are two ways to select a metric from another object:
-
to select the object from the dropdown list, then to select the metric;
-
to enter the object ID and the metric name, separated with colon, in double curly braces into the field Formula, for example {{5a0954cbe3c02d7029c717c4:MEM.percentUsed}}.
-
-
Click the button
 :
:
|
The objects in the dropdown list are sorted with the following way:
|
Adding a multigraph
In order to add a multigraph, several constants or metrics from the current object or any other ones must be selected, using the buttons
 | add a formula,
 | delete a formula.
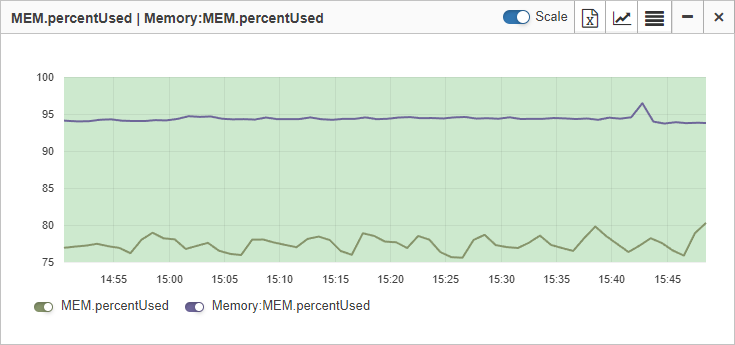
| Formulas in the header of the graph are in the same order as during the setting. |
| Using the switches near the formulas in the multigraph legend, the individual graphs, that compose the multigraph, can be hidden and showed. |
Multigraphs can be used to plot additional graphs for constant values, for instance, to display max and min levels for metrics:
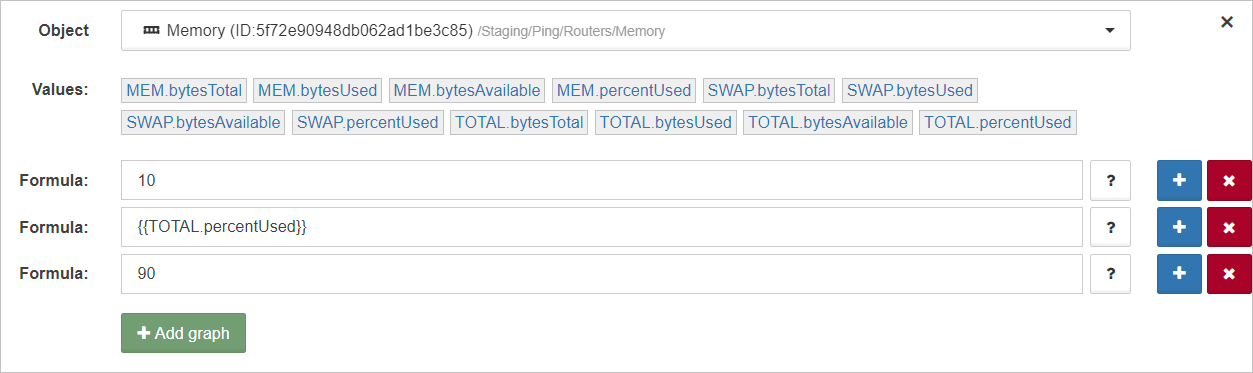
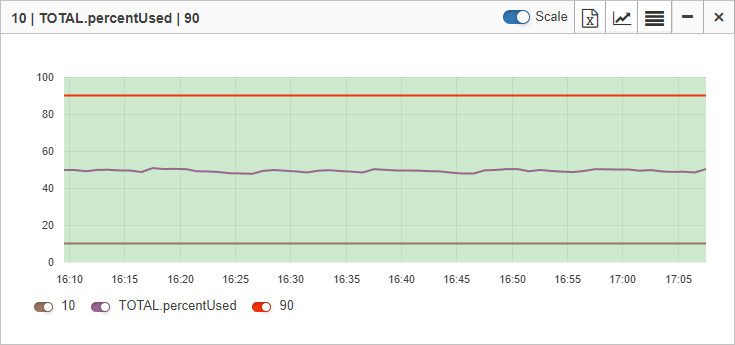
|
A joint graph is available for any object: the |
