Maths on graphs
If the graphs on numeric metrics are not enough, the functional Maths on graphs can be used. For instance, it can be used for plotting a graph of:
-
the total CPU load of several hosts, e.g. the main and the backup,
-
the ratio of successful transactions to their total number,
-
the revenue difference in two stores
and more.
Plotting graphs using mathematical operations
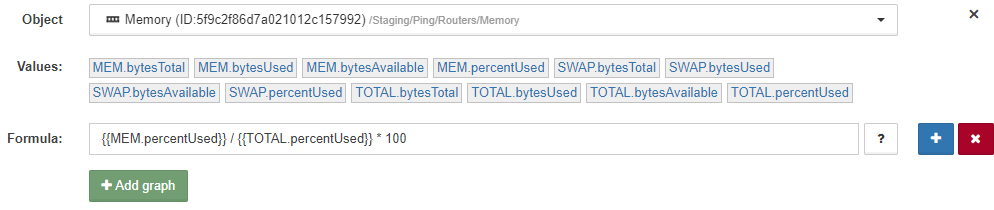
Creating a graph based on mathematical operations is similar to adding a new graph. It is possible to select the necessary metrics from the list, use mathematical operations, braces and constants.
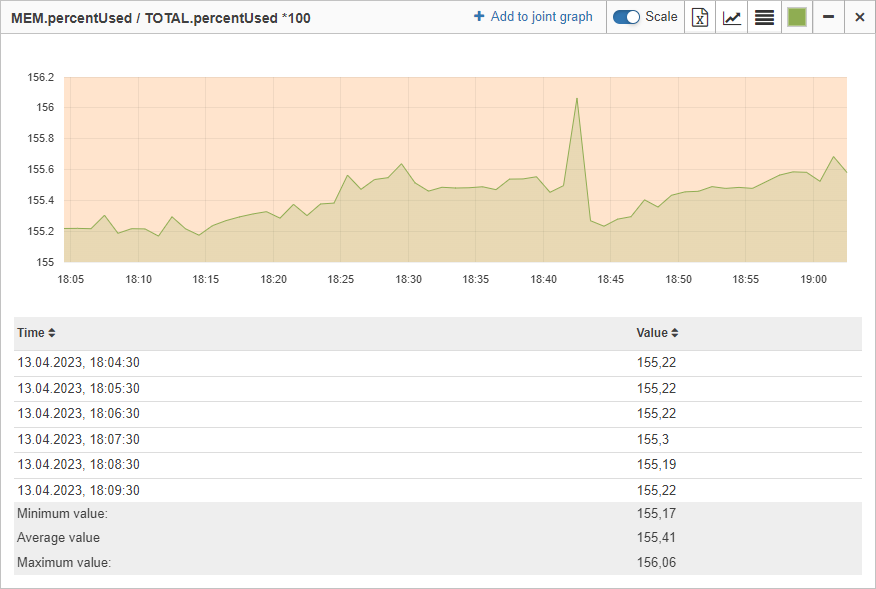
Example:
The same operations, operators and functions as in State change conditions are available here.
Example of using functions
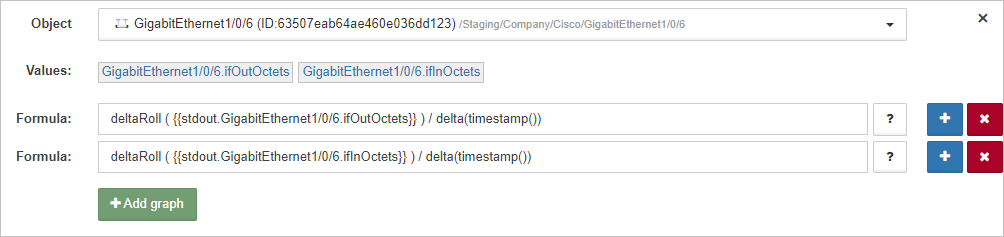
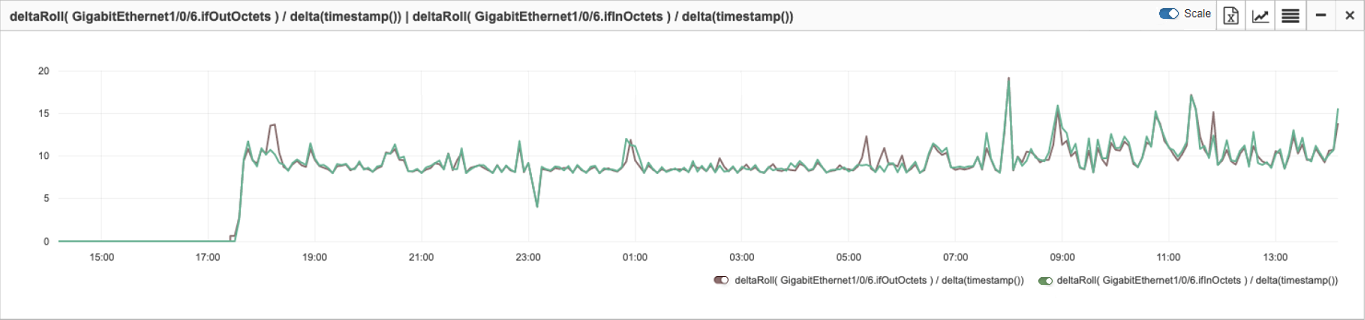
Below is an example of using several functions for plotting graphs of interface load with the 'accumulative' metrics iflnOctets and ifOutOctets, which are gathered from the device via the SNMP Get protocol.
The following functions are used in the example:
Function |
Description |
||
delta(x) |
Difference between the current and the previous value of the x. |
||
deltaRoll(x) |
Only positive difference between the current and the previous value of the x. Negative value is replaced with the last non-negative result.
|
||
timestamp() |
Timestamp of each metric from the returned series of values. The format is 13-digit integer (milliseconds).
|
Use several formulas to add more than one graph to a single scale: