Widgets gallery
Widgets are designed to visualize data from objects and links.
Widgets can be added to any object or link using data from any object or link in the system. For example, to create dashboards or reports.
Widgets displaying
Widgets are displayed:
-
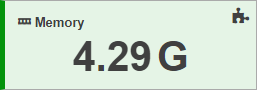
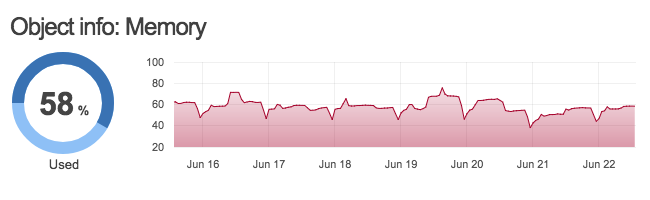
directly on the object in the Standard view:
-
directly on the object in the Table view in the column Widgets:
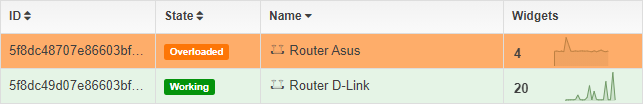
-
directly on the object in the Grid view (the first widget only):
-
in the link pop-up window:
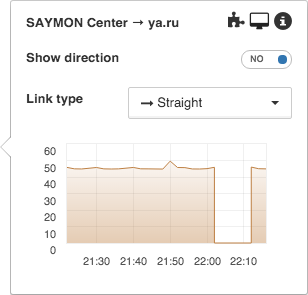
-
in the section Widgets of objects and links:
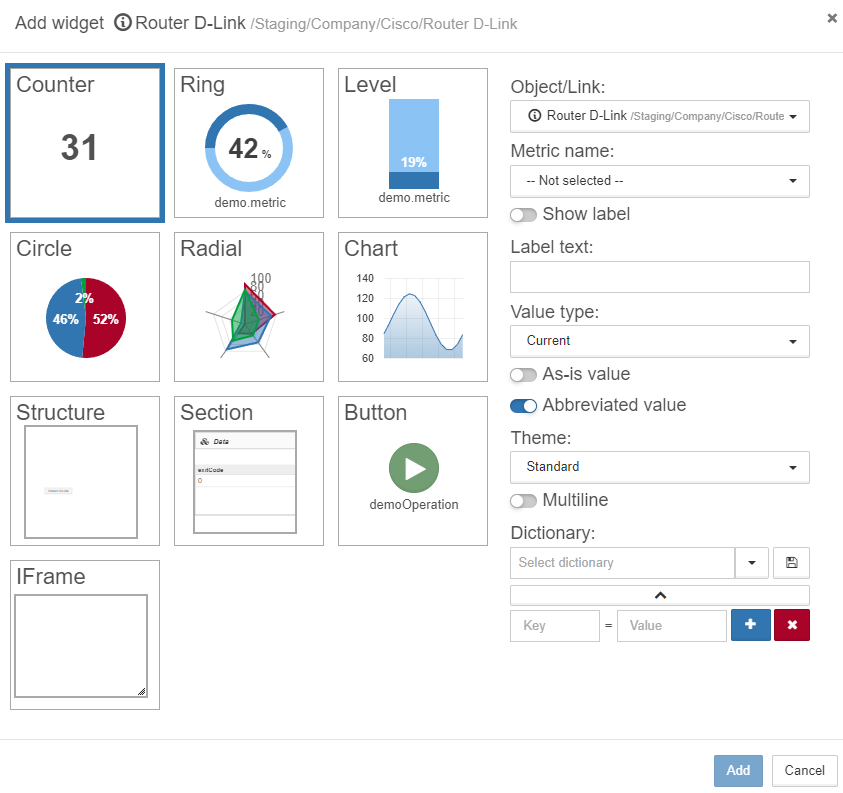
Widgets creation
To create a new widget it is necessary to:
-
Open the window Add widget with one of the following ways:
-
in the object or link End view click the button
 in the panel Breadcrumbs;
 -
in the Standard view click the icon
 after hovering the mouse cursor over the object, or in the link pop-up window.
-
-
Select widget type.
-
Select an object to get data from (by default it is the current object).
-
Select a metric to display.
-
Set widget specific parameters.
To edit  or delete
  a widget it is sufficient to put the mouse cursor over the widget and click the corresponding icon.
Widgets order and size can be changed by dragging-and-dropping.
Widgets publishing on external sites
Widgets can be embedded into an external site.
To embed a widget, do the following:
-
Hover the mouse cursor over the widget.
-
Click the
 button (widget code).
 -
Copy and paste the HTML code to your page.
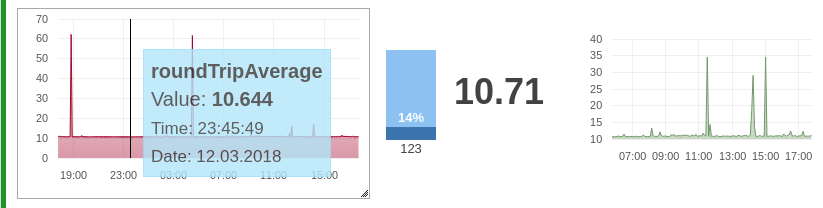
Embedded widgets contain the following data:
-
time period of data showing (for charts),
-
header (label).
| Embedded widgets are not updated in real time. Refresh the page to get updated data. |
The following widgets can be embedded:
Widget settings
Embedded widgets can be customized.
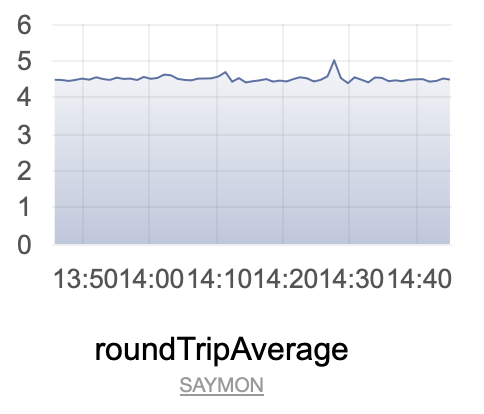
<iframe
    src="http://192.168.1.48/embedded-widgets/html/chart.html?token=71656418-8912-42a3-b151-3b91c63df707&height=160&width=250&linkUrl=http://saymon.info/&linkName=SAYMON&duration=3600000&metricCaption=roundTripAverage"
    height="215" width="262" frameborder="0">
</iframe>
Widgets parameters:
-
src– link to metric; -
height– height of the iframe component. Does not influence the chart height; -
width– width of the iframe component. Does not influence the chart width; -
frameborder– width of the border around the widget (in pixels).
Link parameters:
-
token– API token that is used to get the metric data without additional authentication. You can find more information about using and generating those tokens in the REST API documentation; -
height– chart height. Does not influence the widget height; -
width– chart width. Does not influence the widget width; -
linkUrl– URL of the widget link; -
linkName– text of the widget link; -
duration– amount of time for which to show the data on the chart (in milliseconds); -
metricCaption– caption of the metric displayed on the chart. Can be different from the metric name in SAYMON object.
You can configure default values of the linkUrl and linkName parameters in the Web application configuration.