Page with graphs
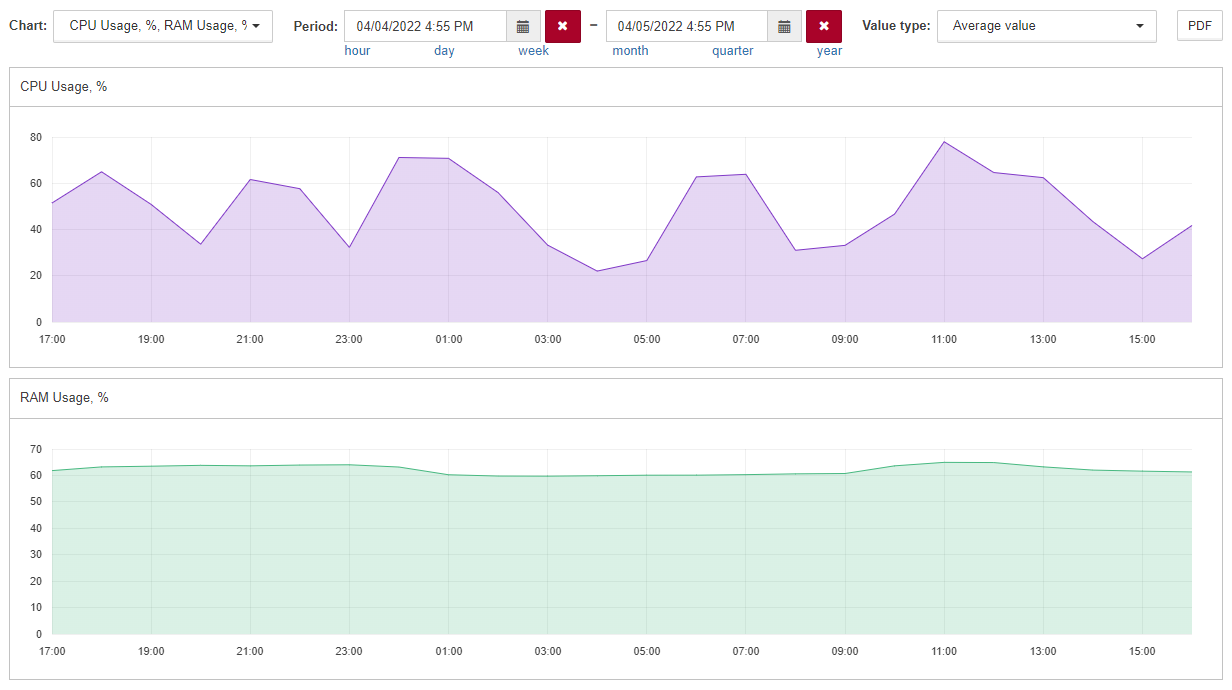
It is possible to create a special web page in the system with a set of graphs from one or several objects. This page can be used to generate PDF report or embed to IFrame widget.
The graphs, that are set up in the one of the system objects - the "main object" - can be displayed on the page.
Main object setting up
Any system object can be the main object for a page with graphs.
It is necessary to specify metrics for graphs in properties of the main object using the following format of their names and values:
Property name
The metric name is specified in the property’s name in the following format:
chart:<metric_name>
If it is necessary to add a metric from another object, the object ID must be added as follows:
chart:<external_object_ID>:<metric_name>
Property value
The displayed name of the graph is specified in the property’s value:
<displayed_graph_name>
Examples
| Property name | Property value | Description |
|---|---|---|
chart:TOTAL.percentUsed |
RAM Usage, % |
The graph of the percentUsed metric of the main object |
chart:61a662bdde9e7970b38b340c:percentageUsage.combined |
CPU Usage, % |
The graph of the percentageUsage.combined metric of the object with ID=61a662bdde9e7970b38b340c |
URL parameters description
The page with graphs is available by url in the following format:
https://<SAYMON_server_address>/iframe-widgets.html?#widget/selectable-chart/<main_object_ID>/<additional_parameters>/
where:
-
<SAYMON_server_address> (required) is the IP address or FQDN of the SAYMON installation;
-
<main_object_ID> (required) is the ID of the object that stores the list of the metrics and displayed names in its properties;
-
<additional_parameters> (optional) are settings which determine the initial view of the page when it is loaded.
Example:
https://127.0.0.1/iframe-widgets.html?#widget/selectable-chart/5fcc9a4de0a5393f45fb99f3/chart=61a662bdde9e7970b38b340c:percentageUsage.combined&chart=TOTAL.percentUsed&period=last-24hours&cache=off
In this example:
-
the server works on the localhost and available at the address 127.0.0.1;
-
the main object is the object with ID 5fcc9a4de0a5393f45fb99f3;
-
by default the web page displays the graph of the metric percentageUsage.combined of the object with ID 61a662bdde9e7970b38b340c and the graph of the metric TOTAL.percentUsed of the main object for the last 24 hours;
-
when the page is refreshed the initial parameters are loaded - cache=off.
Control elements

| Element | Description |
|---|---|
Chart |
The dropdown list to choose displayed graphs of connected metrics. There is a search field above the list of metrics that allows you to filter charts by their names. |
Period |
Time period for graphs displaying. Predefined selectors under "Begin - End" fields are available for the last
|
Value type |
Aggregation function to calculate and plot subsets of data points which are got for the requested period from server:
|
The button to download the PDF file with graphs. You can find out more about exporting charts and data to PDF in the Export PDF sections. |
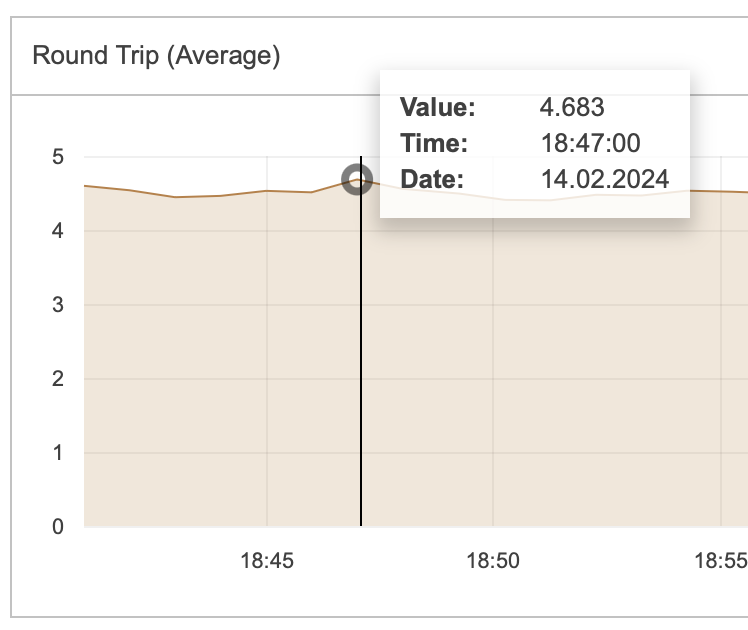
Some control elements are also available on the charts.
When you hover a cursor over a chart, a popup appears. This popup has a value at the timestamp under the cursor.
When you press the ![]() button, a list of metric values opens.
button, a list of metric values opens.
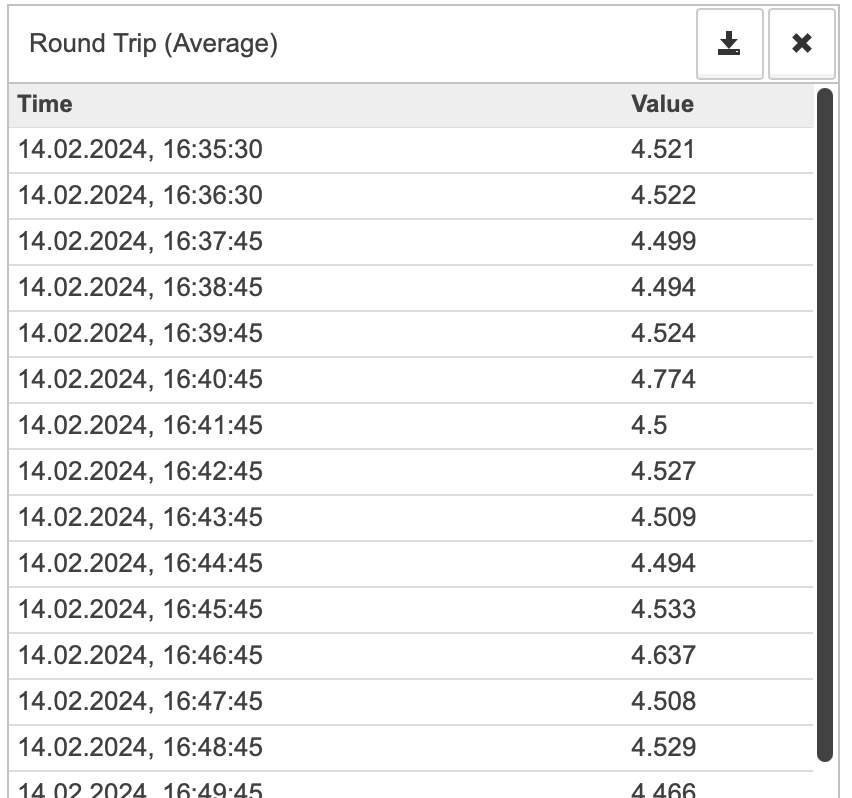
Values in that list depend on the selected time period.
| If you export charts as PDF with a values list open, this list will be included in the exported file. |
When you press the ![]() button, the page will export the list of values in the CSV format.
button, the page will export the list of values in the CSV format.
You can close the list with the ![]() button.
button.
Additional URL parameters
You can use query parameters to define initial settings that are applied when the page loads. You can change those settings with control elements later.
| Parameter | Possible values | Description |
|---|---|---|
chart |
|
Graphs which are displayed when loading the page. By default the page is loaded with all graphs hidden. |
period |
|
Time period to plot the graphs for when loading the page. By default the graphs for the last hour are displayed. |
aggregate |
|
Value type which is applied when loading the page. By default the aggregate=avg value is applied. |
cache |
|
Priority between user settings and additional URL parameters, when refreshing the page. By default, when refreshing the page, all changes made by the user are saved. |
widget-instance-id |
The value of this parameter is the preset name. The name is unique within the frame of the main object. Any set of symbols can be used as the value. Examples:
|
Saves the settings of the page in the individual preset with the unique name. By default the settings are not saved in a preset. |
Presets of the graphs page
The widget-instance-id parameter allows to save settings, made by the user, in a preset with the corresponding name.
The names of the presets are set by users arbitrarily.
| This functional can be used when it is necessary to view graphs of the same metrics with different settings simultaneously. |
If the same page is embedded into several IFrame-widgets, all the changes, made with control elements on one of the widgets, are applied to the others. The settings changes can be saved as the unique presets using the widget-instance-id parameter. The name of the preset is equal to the value of the parameter.
If the widget-instance-id parameter is specified in the URL, the settings changes, made via the other IFrame-widgets with the same graphs page, do not affect on the settings, saved in the preset.
The value of the widget-instance-id parameter can be changed in the settings of the IFrame-widget, in order to create another preset or restore settings from a previously saved one.
Example of graph page URL with widget-instance-id:
http://127.0.0.1/iframe-widgets.html?#widget/selectable-chart/5fcc9a4de0a5393f45fb99f3/widget-instance-id=default
In this example:
-
the server works on the localhost and available at the address 127.0.0.1;
-
the main object is the object with ID 5fcc9a4de0a5393f45fb99f3;
-
the settings of displaying the page are saved in the preset with the name default.
Export PDF
The PDF button in the top right corner of the screen exports the current data on the page as a PDF file.
Exported file contains the following information:
-
Period;
-
Aggregation type;
-
All opened charts;
-
Metrics list (if opened during the export).
| Language of the text in the PDF file depends on the language selected in the web interface. |
| You can’t open multiple lists with metric values, so you can include a single list in the PDF file. |